
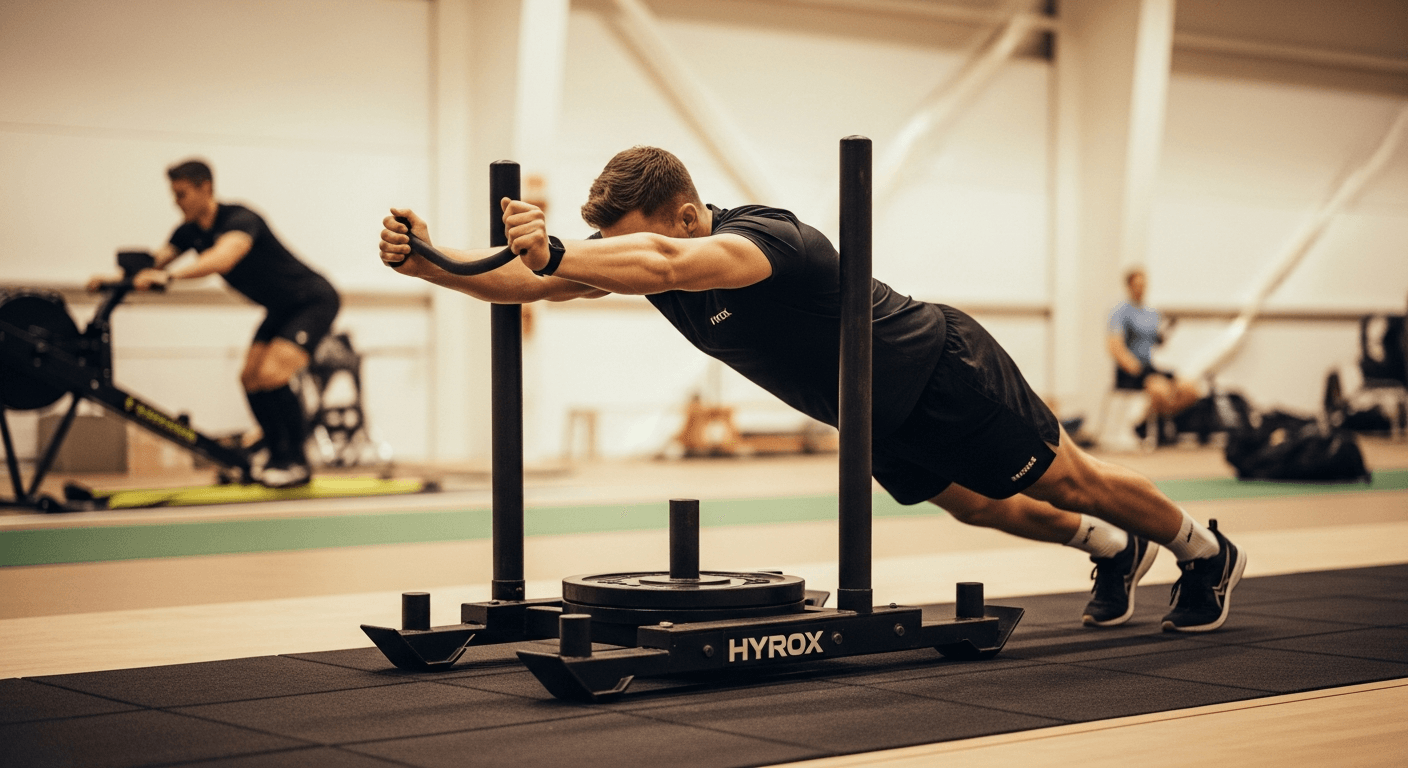
For years, HYROX athletes have had one primary feedback mechanism: their finish time. You crossed the line, checked the leaderboard, and tried to infer where you'd lost ground from a single number. That's changing. A study published on May 26, 2026 in the Journal of Sports Medicine and Physical Fitness has released the most detailed performance benchmarks the sport has ever seen, breaking down expected times at every one of the eight workout stations, sorted by competitor category. You now have a diagnostic tool, not just a result.
What the Research Actually Published
The study analyzed race data from thousands of HYROX competitors across multiple events, producing category-specific benchmarks for all eight workout stations: the SkiErg, sled push, sled pull, burpee broad jumps, rowing, farmers carry, sandbag lunges, and wall balls. Benchmarks are segmented by division, meaning Open, Pro, and age-group categories each have their own reference points.
That segmentation matters more than it might seem. A 45-year-old age-group competitor comparing their wall ball split to a Pro Open benchmark is drawing a meaningless comparison. The new data lets you compare your ski erg time against athletes in the same category, in the same race format, under the same rules. It's an apples-to-apples diagnostic framework the sport hasn't had before.
The benchmarks also account for cumulative fatigue. Station performance doesn't exist in isolation. Your sandbag lunge split in the seventh workout reflects six prior efforts. The research team controlled for this in how reference ranges were constructed, which makes the data considerably more useful for training prescription than raw split data scraped from public results.
The Two Stations Where Average Competitors Lose the Most Time
The data is clear on this: wall balls and the ski erg are the two stations where the gap between average competitors and elites is widest, relative to the total time each station demands. These aren't necessarily the slowest stations in absolute terms, but they're where mid-pack athletes consistently fall furthest behind their category benchmarks.
Wall balls are a muscular endurance problem layered on top of a cardiovascular one. The pattern the research identifies is a significant slowdown in the second half of the set, suggesting that most athletes begin at a pace they can't sustain. Elite competitors in the Open category maintain a more consistent cadence from rep one to rep one hundred. Average competitors start fast and deteriorate. The time lost isn't in a single catastrophic pause. It accumulates across dozens of small breaks and rhythm disruptions.
The ski erg result is slightly different. Here, the time gap appears to relate more to technique and power output than to pacing strategy. The erg rewards a specific movement pattern. Athletes who train predominantly on treadmills and running tracks haven't developed the upper-body pulling endurance or the hip hinge mechanics that the ski erg demands. If you've treated the ski erg as an afterthought in your training, this data gives you a quantified reason to reconsider that decision.
How to Read Your Benchmarks Against the Category Data
You'll need your official split data from a recent race. Most HYROX events now provide per-station timing in your results profile. Once you have those, here's the process:
- Match your category precisely. Use the benchmark ranges for your specific division and age group. Don't benchmark yourself against Open Pro times unless you're competing in that category.
- Calculate your gap per station. Express each station's gap not just in absolute seconds, but as a percentage of the benchmark time. A 45-second gap on a station that takes elites 3 minutes is a larger proportional deficit than a 45-second gap on a station that takes them 7 minutes.
- Identify your two or three biggest gap stations. These are your highest-leverage training targets. Trying to improve everywhere simultaneously dilutes your training stimulus.
- Look at whether your gaps cluster. Multiple deficits in upper-body pushing or pulling stations suggests a different training priority than multiple deficits in leg-dominant stations.
The research is explicit that athletes who structure training around their identified weak stations, rather than general fitness volume, show the highest rate of race-time improvement across subsequent events. That's not a philosophical argument for specificity. It's a finding from the performance data itself.
Structuring Training Blocks Around Your Weakest Stations
Once you know where your benchmarks sit, training block design becomes more mechanical. You're not guessing at what to prioritize. The question shifts from "what should I work on?" to "how much volume and at what intensity?"
For wall balls specifically, the research supports increasing set volume at sub-maximal intensity before adding speed. Most athletes training for improvement start by trying to go faster. The data suggests that building the capacity to maintain a consistent rhythm for the full 100-rep set at race pace is the more productive initial target. Broken sets destroy your time. Consistency at a slightly slower pace beats a fast start with multiple rest breaks.
For the ski erg, technique work yields faster returns than fitness work at the early stage of improvement. If your pulling mechanics are inefficient, adding more ski erg volume at poor technique just reinforces movement patterns that cap your output. A few focused sessions on hip extension timing and arm pull sequencing will transfer to the erg in ways that additional cardio volume won't.
This kind of targeted approach applies to training structure more broadly. The same principle that governs station-specific HYROX work underlies the emerging research on resistance training design. New global lifting guidelines bust the training-to-failure myth, showing that intensity management, not maximum effort on every set, produces more consistent long-term adaptation. That logic maps directly onto HYROX station training.
Where the Other Six Stations Stand
Wall balls and the ski erg attract the most attention in the data, but they're not the whole picture. The sled push and pull show large absolute gaps between categories, but within-category variance is lower. This means most athletes in a given division perform fairly similarly on sleds, which reduces the diagnostic value of being slightly below benchmark on those stations. You're likely losing less time there than on the skill-dependent stations.
Rowing sits in an interesting middle position. Athletes with a cycling or swimming background often outperform their running-focused peers on the rower, suggesting that aerobic capacity transfer is meaningful here. If rowing is a weak station for you and you have no background in that movement, this is one station where cross-training cardio has a direct payoff.
Burpee broad jumps and farmers carry tend to be the most evenly distributed stations in terms of average-to-elite gap. They're demanding, but they're also more straightforward in their demands. Burpee pacing strategy matters, but there's less technique ceiling than on the erg. Sandbag lunges fall somewhere in between, with the primary variable being grip endurance and load tolerance rather than cardiovascular efficiency.
Your nutrition strategy interacts with all of this more than most athletes acknowledge. The stations in the second half of a HYROX event, where fatigue is highest, are where fueling choices made in the 48 hours before race day show up most clearly. If you haven't built a deliberate pre-race nutrition protocol, the cycling event nutrition race-day fueling guide transfers well to multi-discipline events and gives you a practical framework to start from.
Recovery Between Stations and Its Effect on Benchmark Performance
One finding in the research that's worth noting is the effect of transition time on subsequent station performance. Athletes who minimize transition time without managing their heart rate between stations show a measurable performance drop on the following workout. The fastest overall finishers don't simply run harder between stations. They manage their physiological state during transitions more effectively.
This connects to a broader point about recovery quality during training blocks. The adaptation you're building between sessions determines whether your station-specific work translates to race performance. Protein distribution across the day plays a larger role in that adaptation than most athletes appreciate. The evidence on protein timing and daily distribution challenges some widely held assumptions about when and how much protein you need to support this kind of training load.
Using the Benchmarks as an Ongoing Tool, Not a One-Time Audit
The value of the new benchmark data isn't in a single comparison. It's in tracking your gap closure over time. If your wall ball benchmark gap was 38 seconds in your last race and it's 22 seconds in your next one, you have evidence that your training intervention worked. If it hasn't moved, you have a signal that your approach needs adjustment.
HYROX is still a relatively young sport in terms of performance science. The fact that category-specific station benchmarks didn't exist in published research until 2026 reflects how quickly the athlete base has grown relative to the science supporting it. That gap is now closing. Athletes who use the data available will make faster, more targeted progress than those still training by feel and finish time alone.
The sport has also grown complex enough that event safety and medical protocols are receiving serious attention alongside performance research. If you follow HYROX closely, the athlete death at HYROX Lyon and what it revealed about medical protocols is essential reading for understanding how the governing structure is evolving around participant welfare.
Know your benchmarks. Train your gaps. The data is there to use it.